Mahalanobis Distance Outlier Detection Practice (SPSS)
Only for Archiving
Identifying multivariate outliers is a pivotal step in ensuring the accuracy of statistical analyses involving multiple variables, either independent or dependent. This process, particularly relevant in scenarios employing multiple linear regression or MANOVA, can be adeptly handled within SPSS through a series of methodical steps:
1) Choosing Variables: First, figure out which variables you're working with. This might be a group of variables you're using to predict something in a multiple regression, or a group you're comparing in a MANOVA.
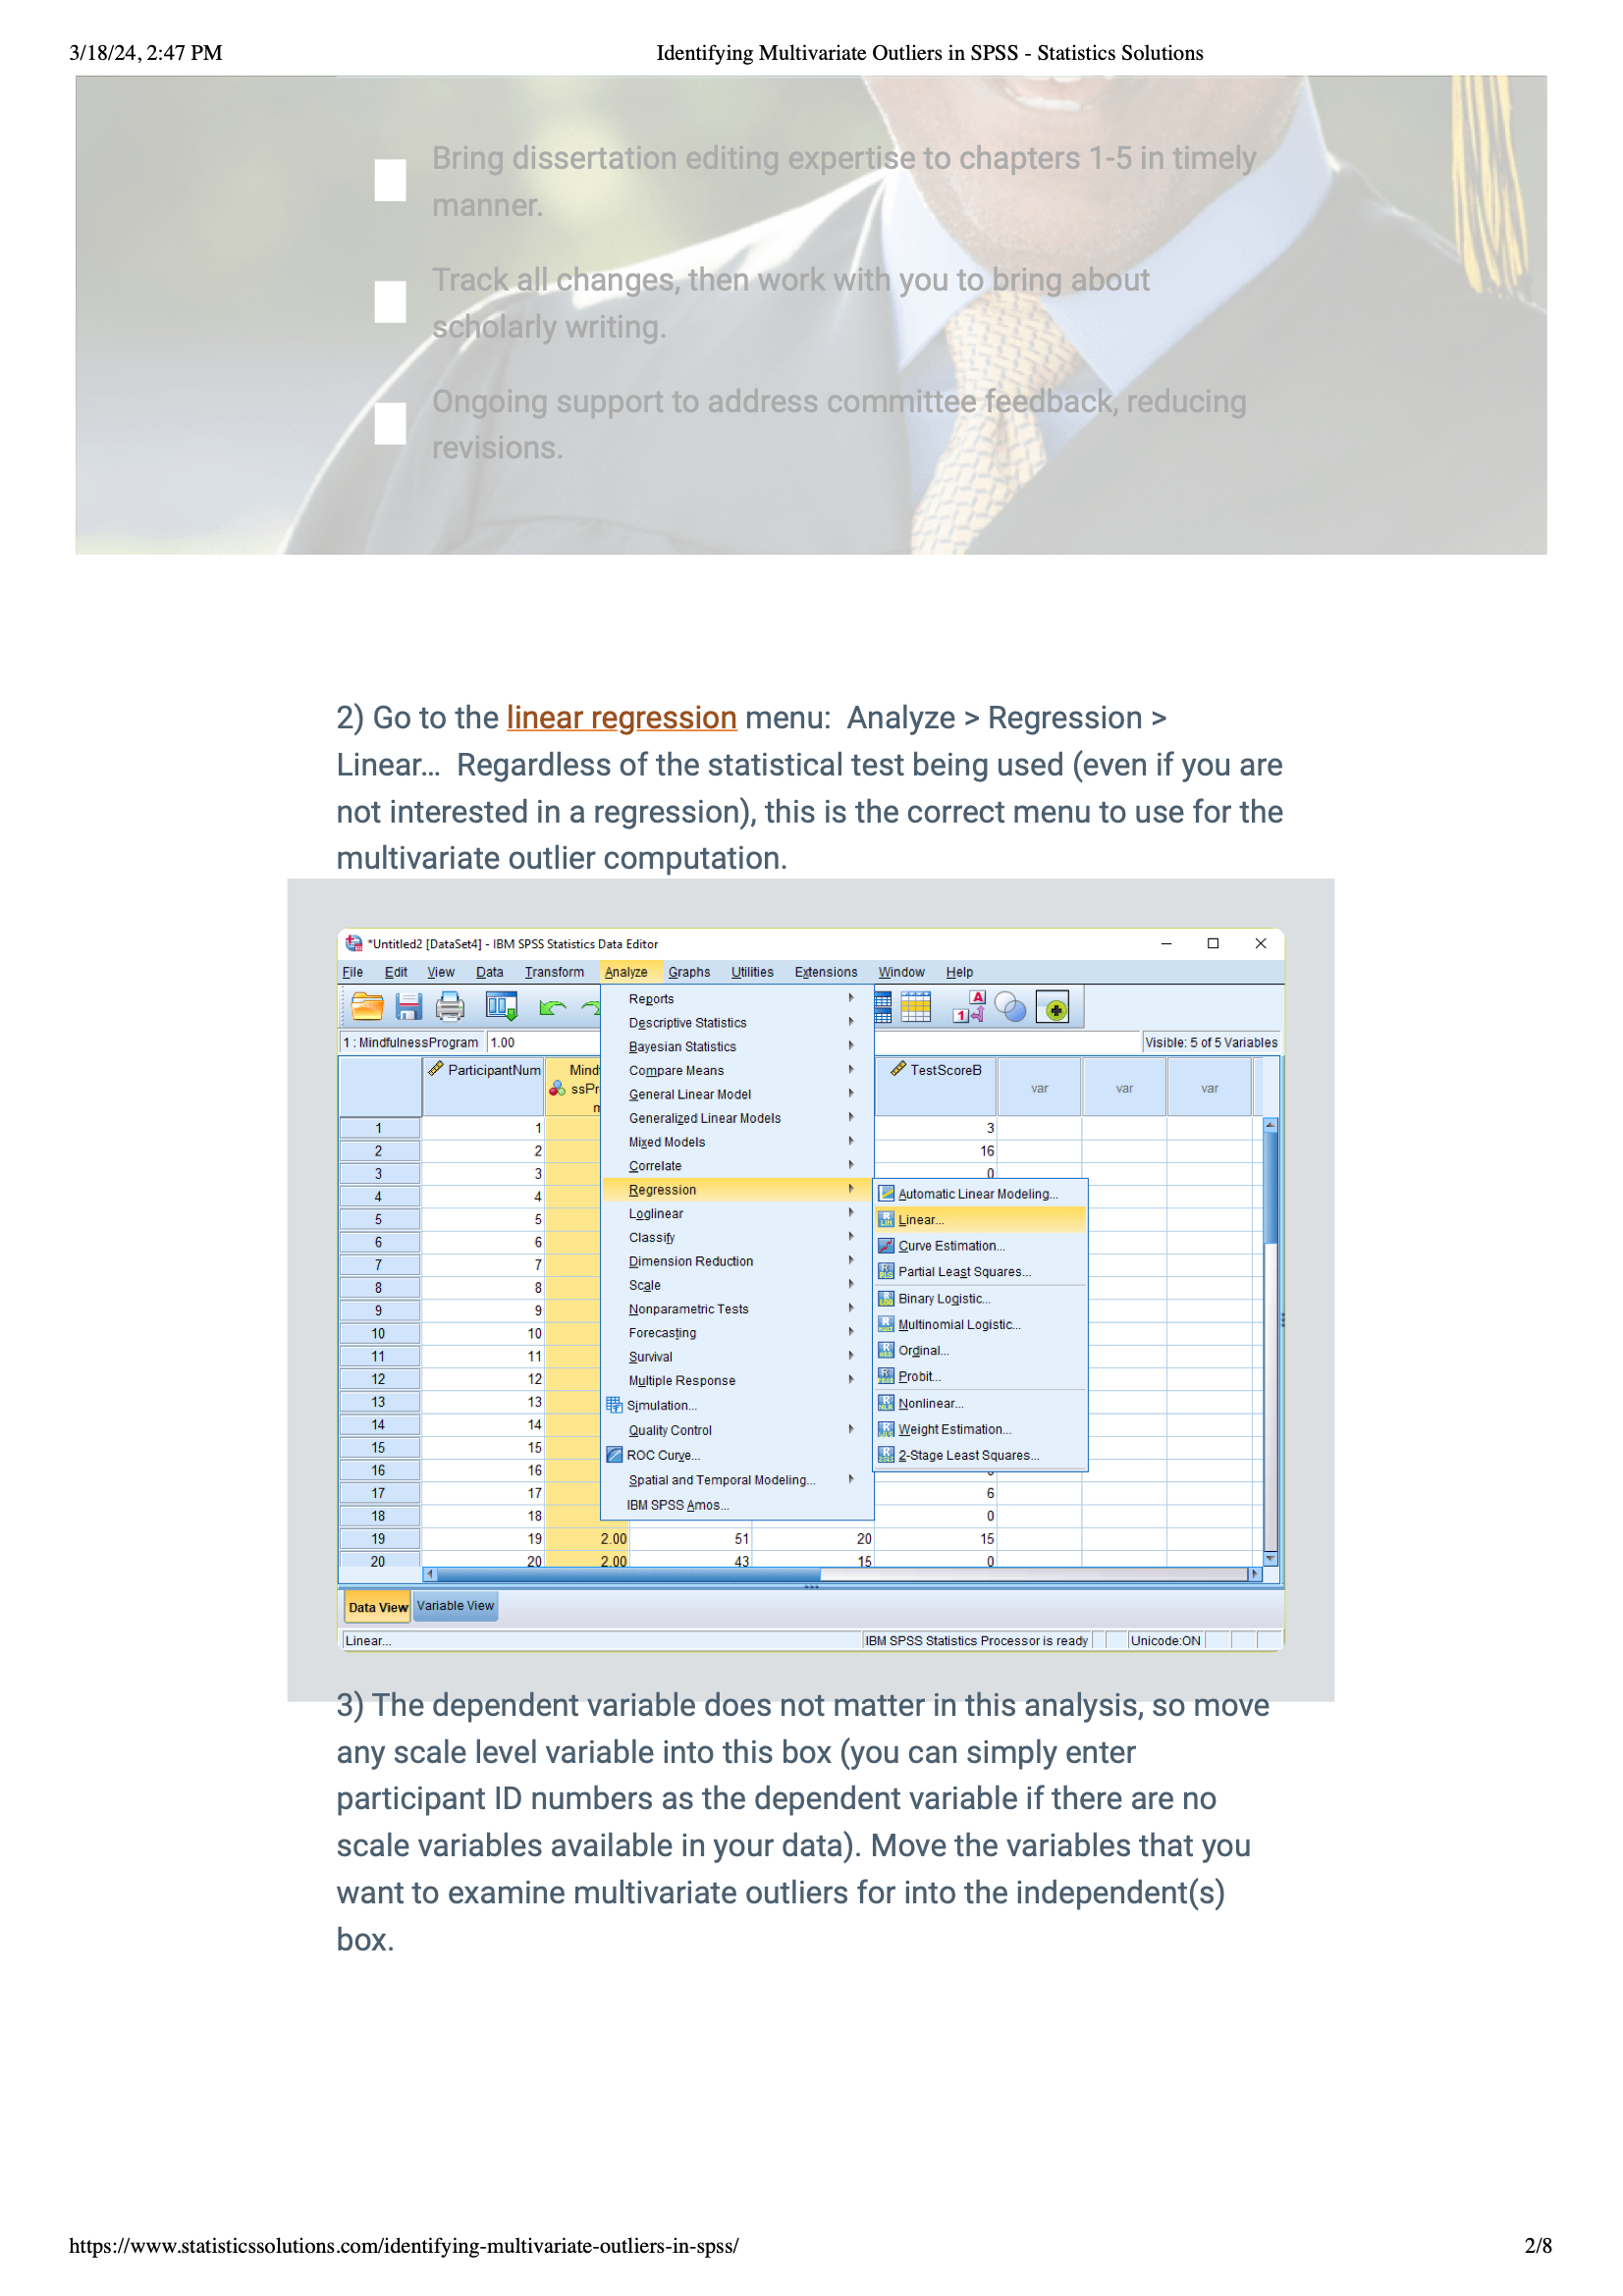
2) Getting Started in SPSS: To check for outliers, open SPSS and go to: Analyze > Regression > Linear… Use this option to find outliers, no matter what your main analysis is.
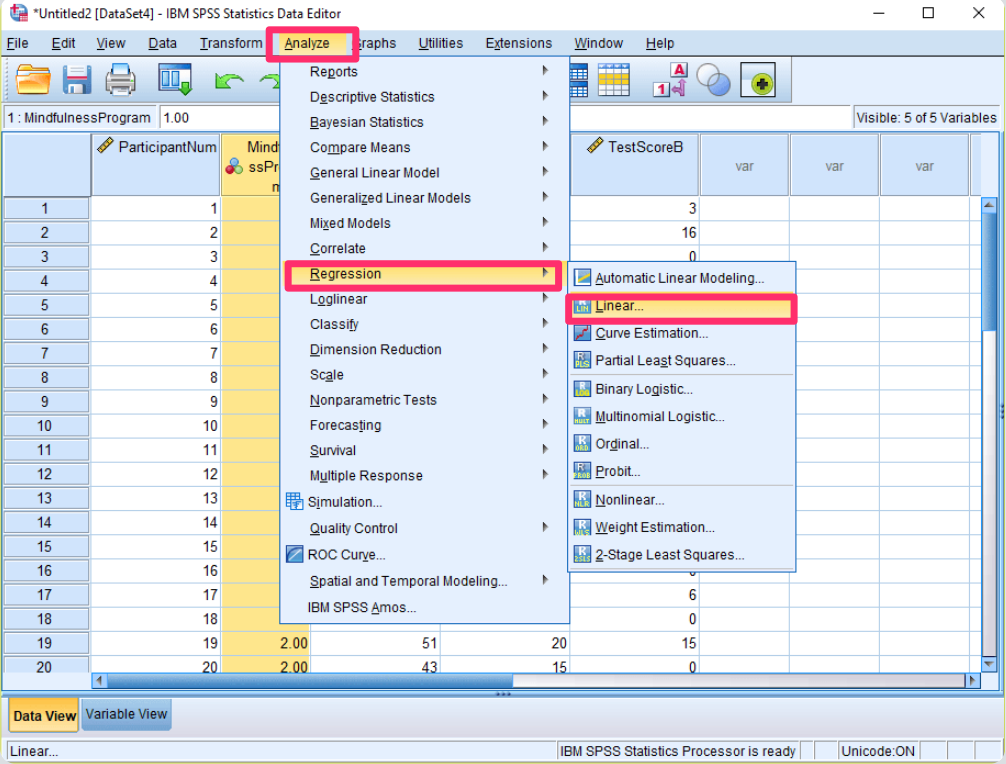
3) Picking a Dependent Variable: At this step, it doesn't really matter which variable you pick as the dependent one.
You can use any variable that has a scale (like age or scores) or even just ID numbers if that's all you have. The important part is moving the variables you want to check for outliers into the "independent" box.

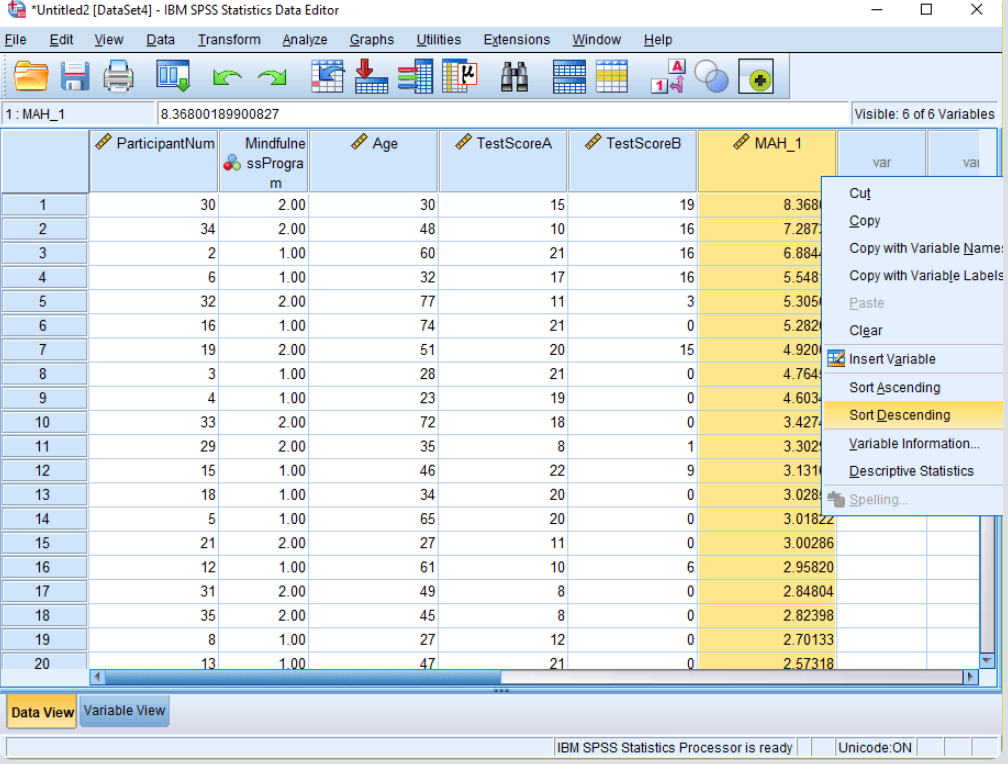
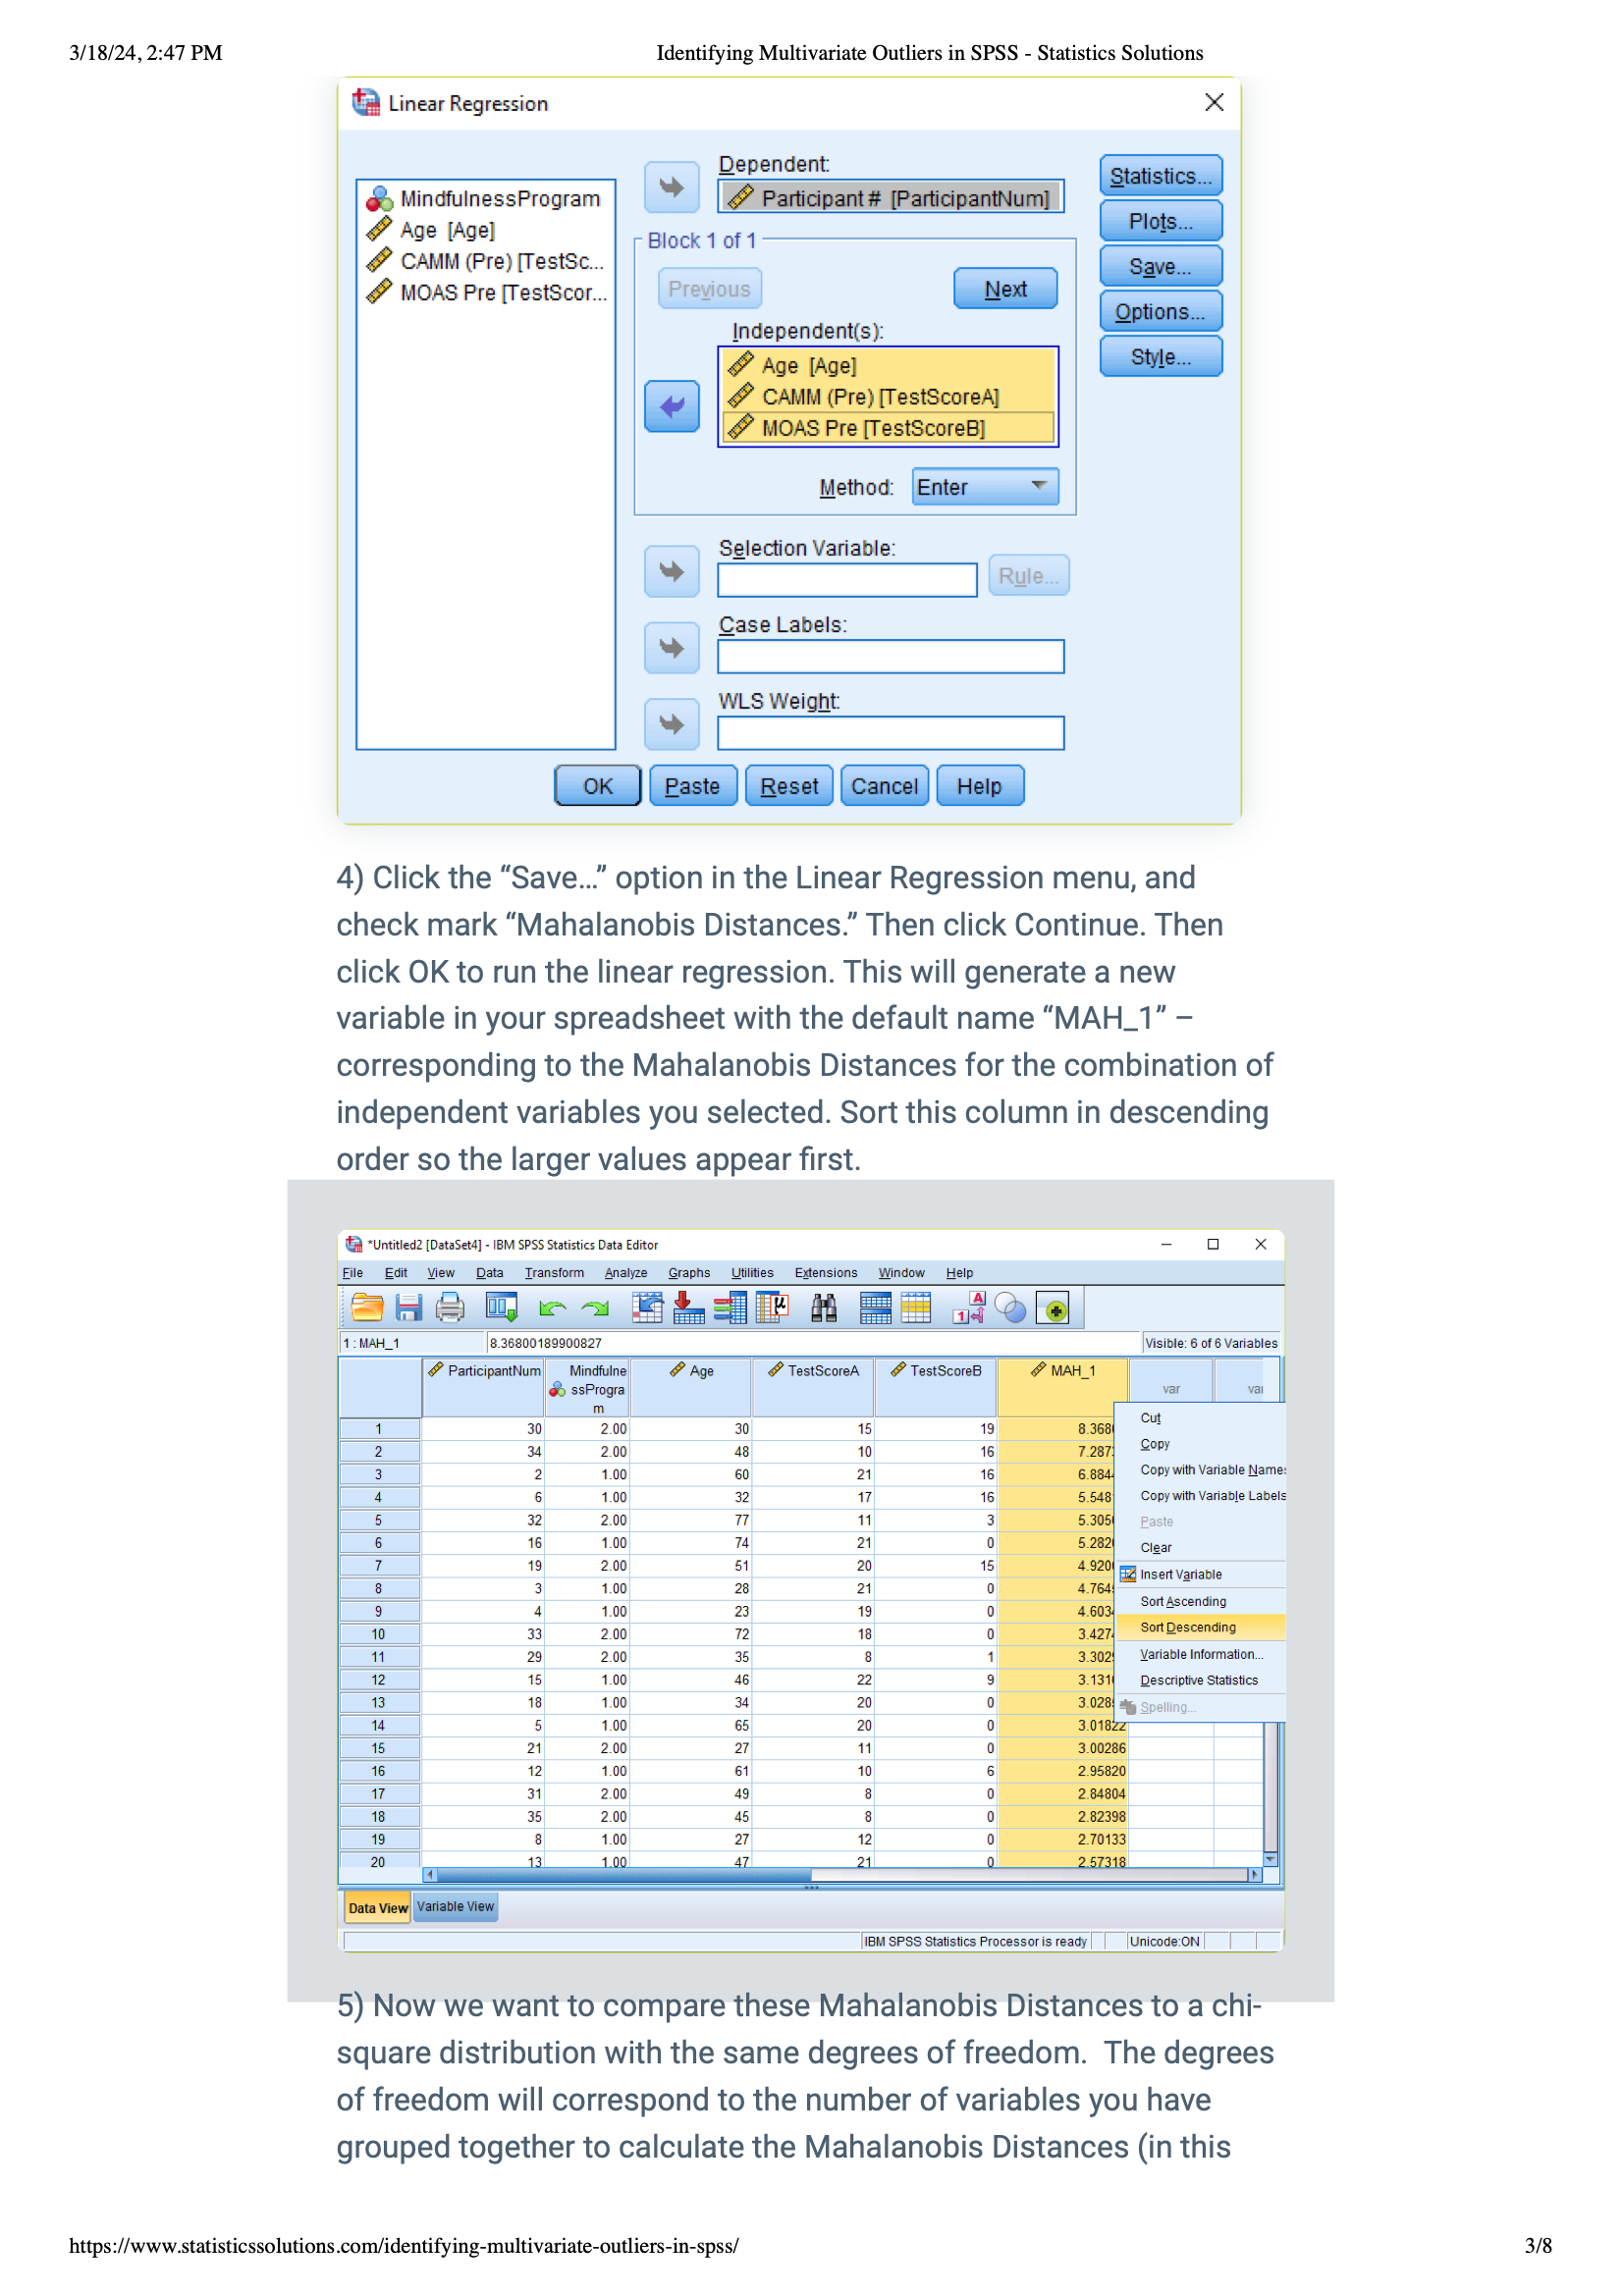
3) Calculating Mahalanobis Distances: Next, click the “Save…” button in the Linear Regression window and choose “Mahalanobis Distances.” This will create a new variable, usually called “MAH_1,” showing the Mahalanobis Distances for your variables. Sort this from high to low (descending order) to see the biggest values first.
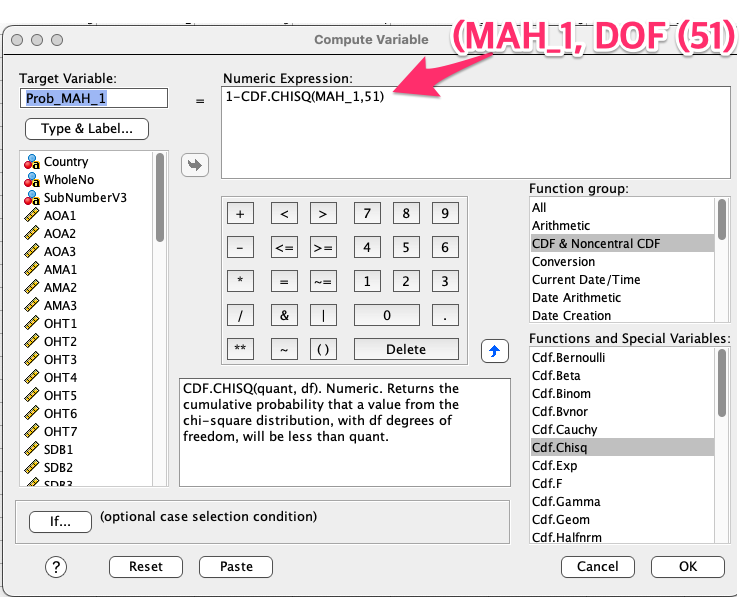
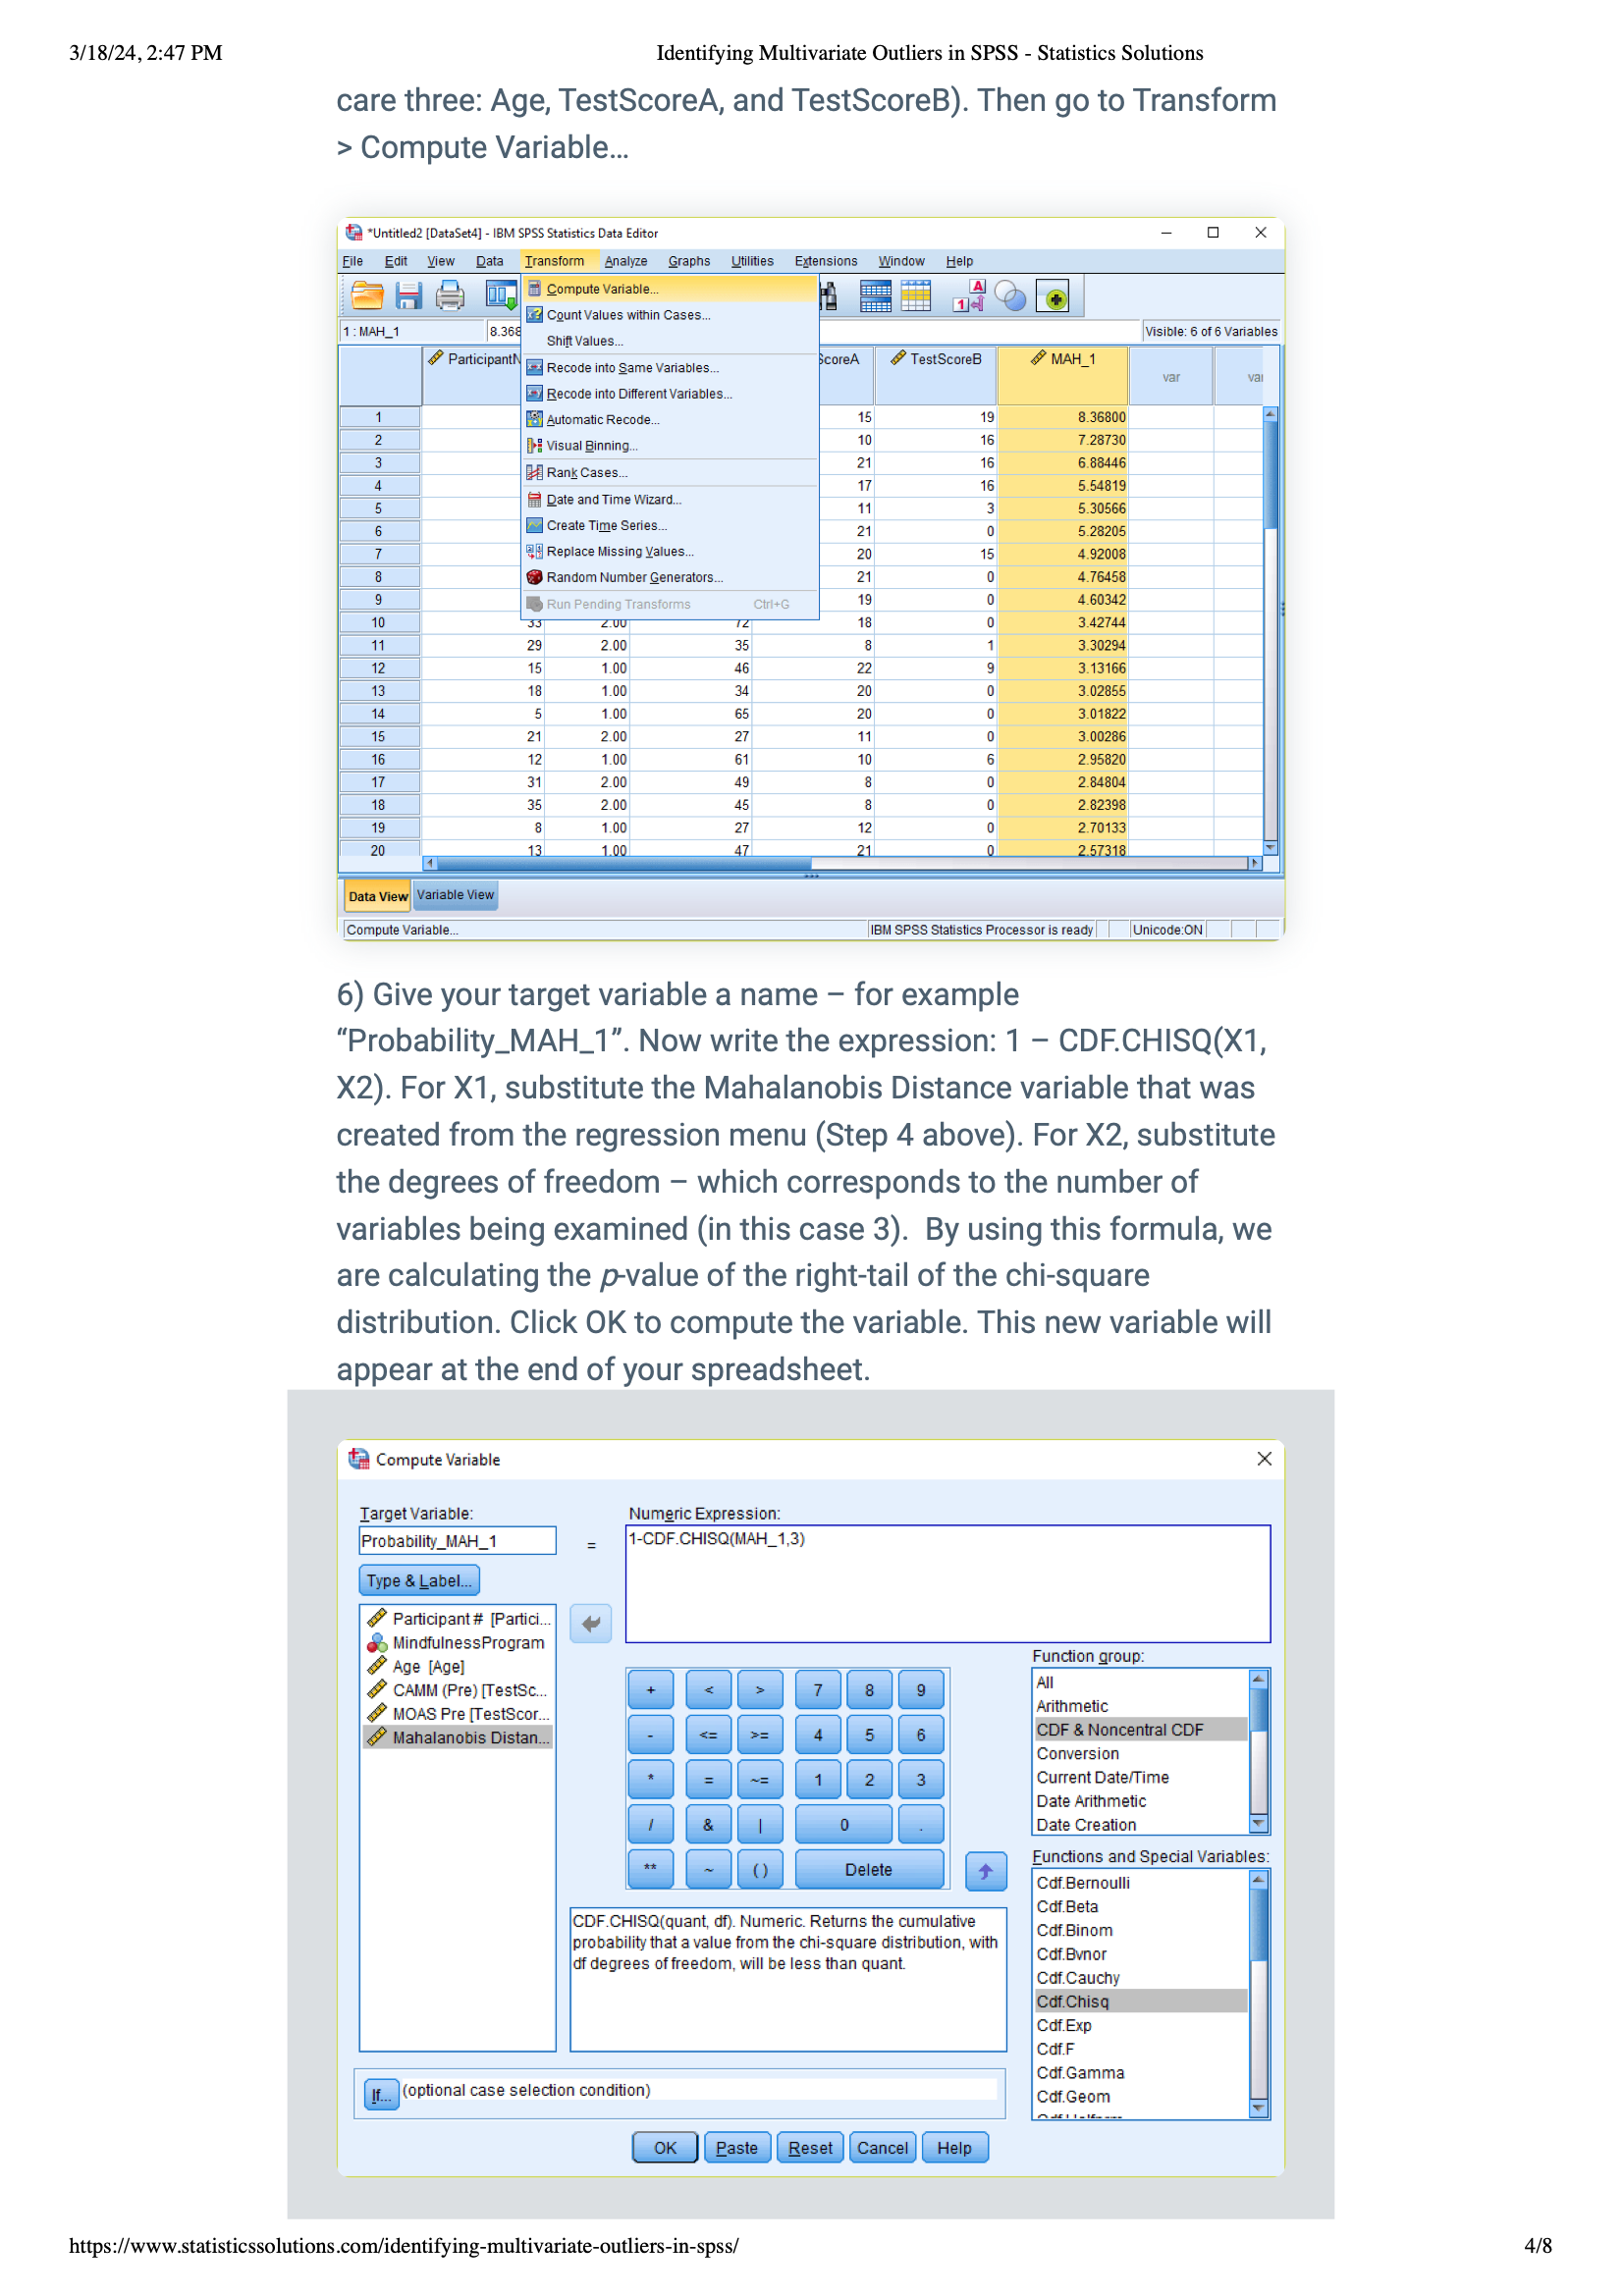
4) Comparing to Chi-square: Now, compare these distances to a chi-square distribution to see if they fit. Do this by going to Transform > Compute Variable… and make a new variable (like “Probability_MAH_1”) that calculates the p-value based on the chi-square distribution.
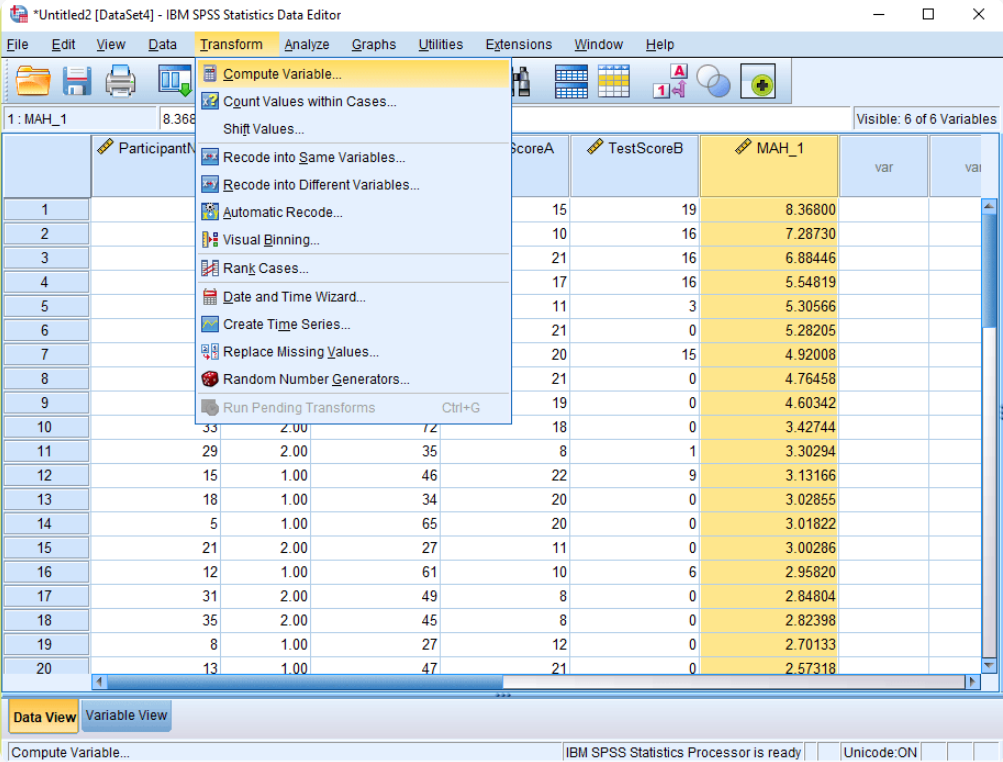
5) Give your target variable a name – for example “Probability_MAH_1”. Now write the expression: 1 – CDF.CHISQ(X1, X2). For X1, substitute the Mahalanobis Distance variable that was created from the regression menu (Step 4 above). For X2, substitute the degrees of freedom – which corresponds to the number of variables being examined (in this case 3). By using this formula, we are calculating the p -value of the right-tail of the chi-square distribution. Click OK to compute the variable. This new variable will appear at the end of your spreadsheet.

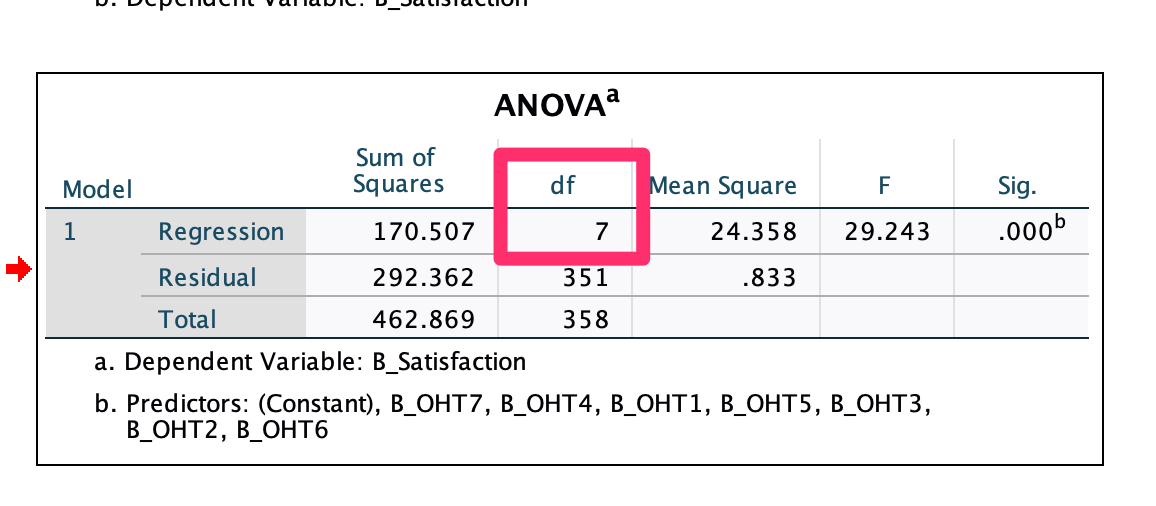
In This Case: Agility Study, Please refer to the ANOVA result at Output, then choose the Degree of Freedom
| Probablity of Mahalanobis Threadhole : < .001 (or < .0001) | Valid Variable | |
| Valid Variable | ||
| KOR1 | Outlier (39 /500 = 7.8%) | 461 |
| KOR2 | Outlier (35/500 = 7.00%) | 465 |
| KOR3 | Outlier (5/359 = 1.39%) | 354 |
| CHN | Outlier (12 / 360 = 3.33%), | 348 |
| JPN | Outlier (13/500 = 2.60%) | 487 |
| Probablity of Mahalanobis Threadhole : < .001 | All area higher than > .01 (DOF = 134, Variable 135-1) | Valid Variable |
| CHN (Leader) | Outlier (0 / 168) | 168 |
| CHN (Teacher) | Outlier (0 / 586) | 586 |
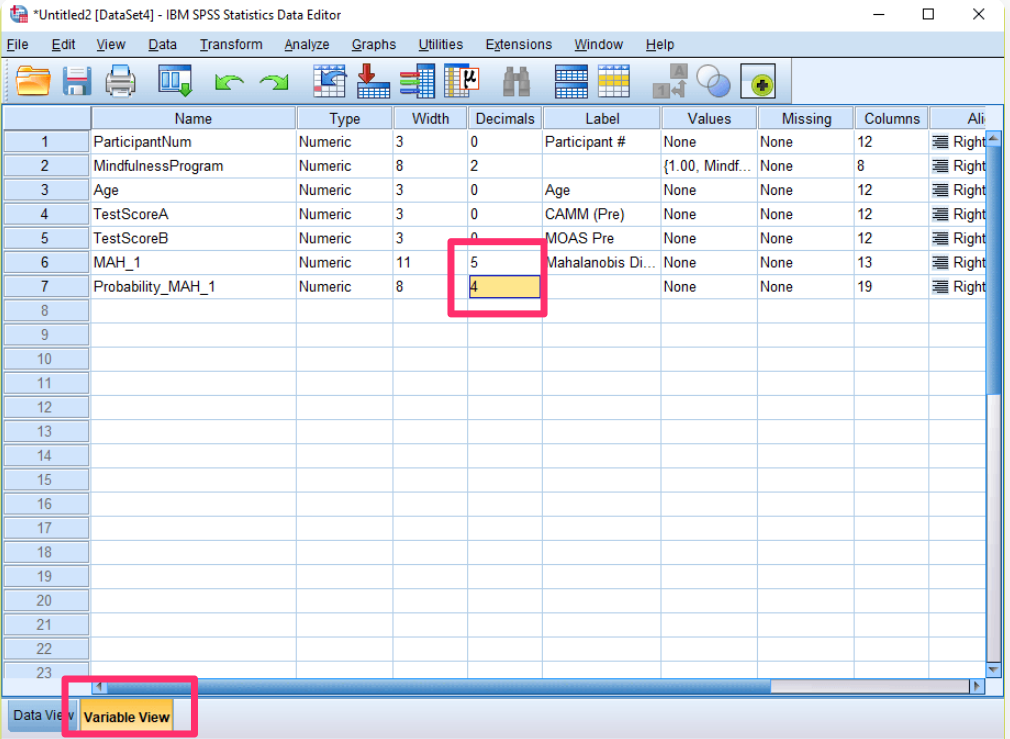
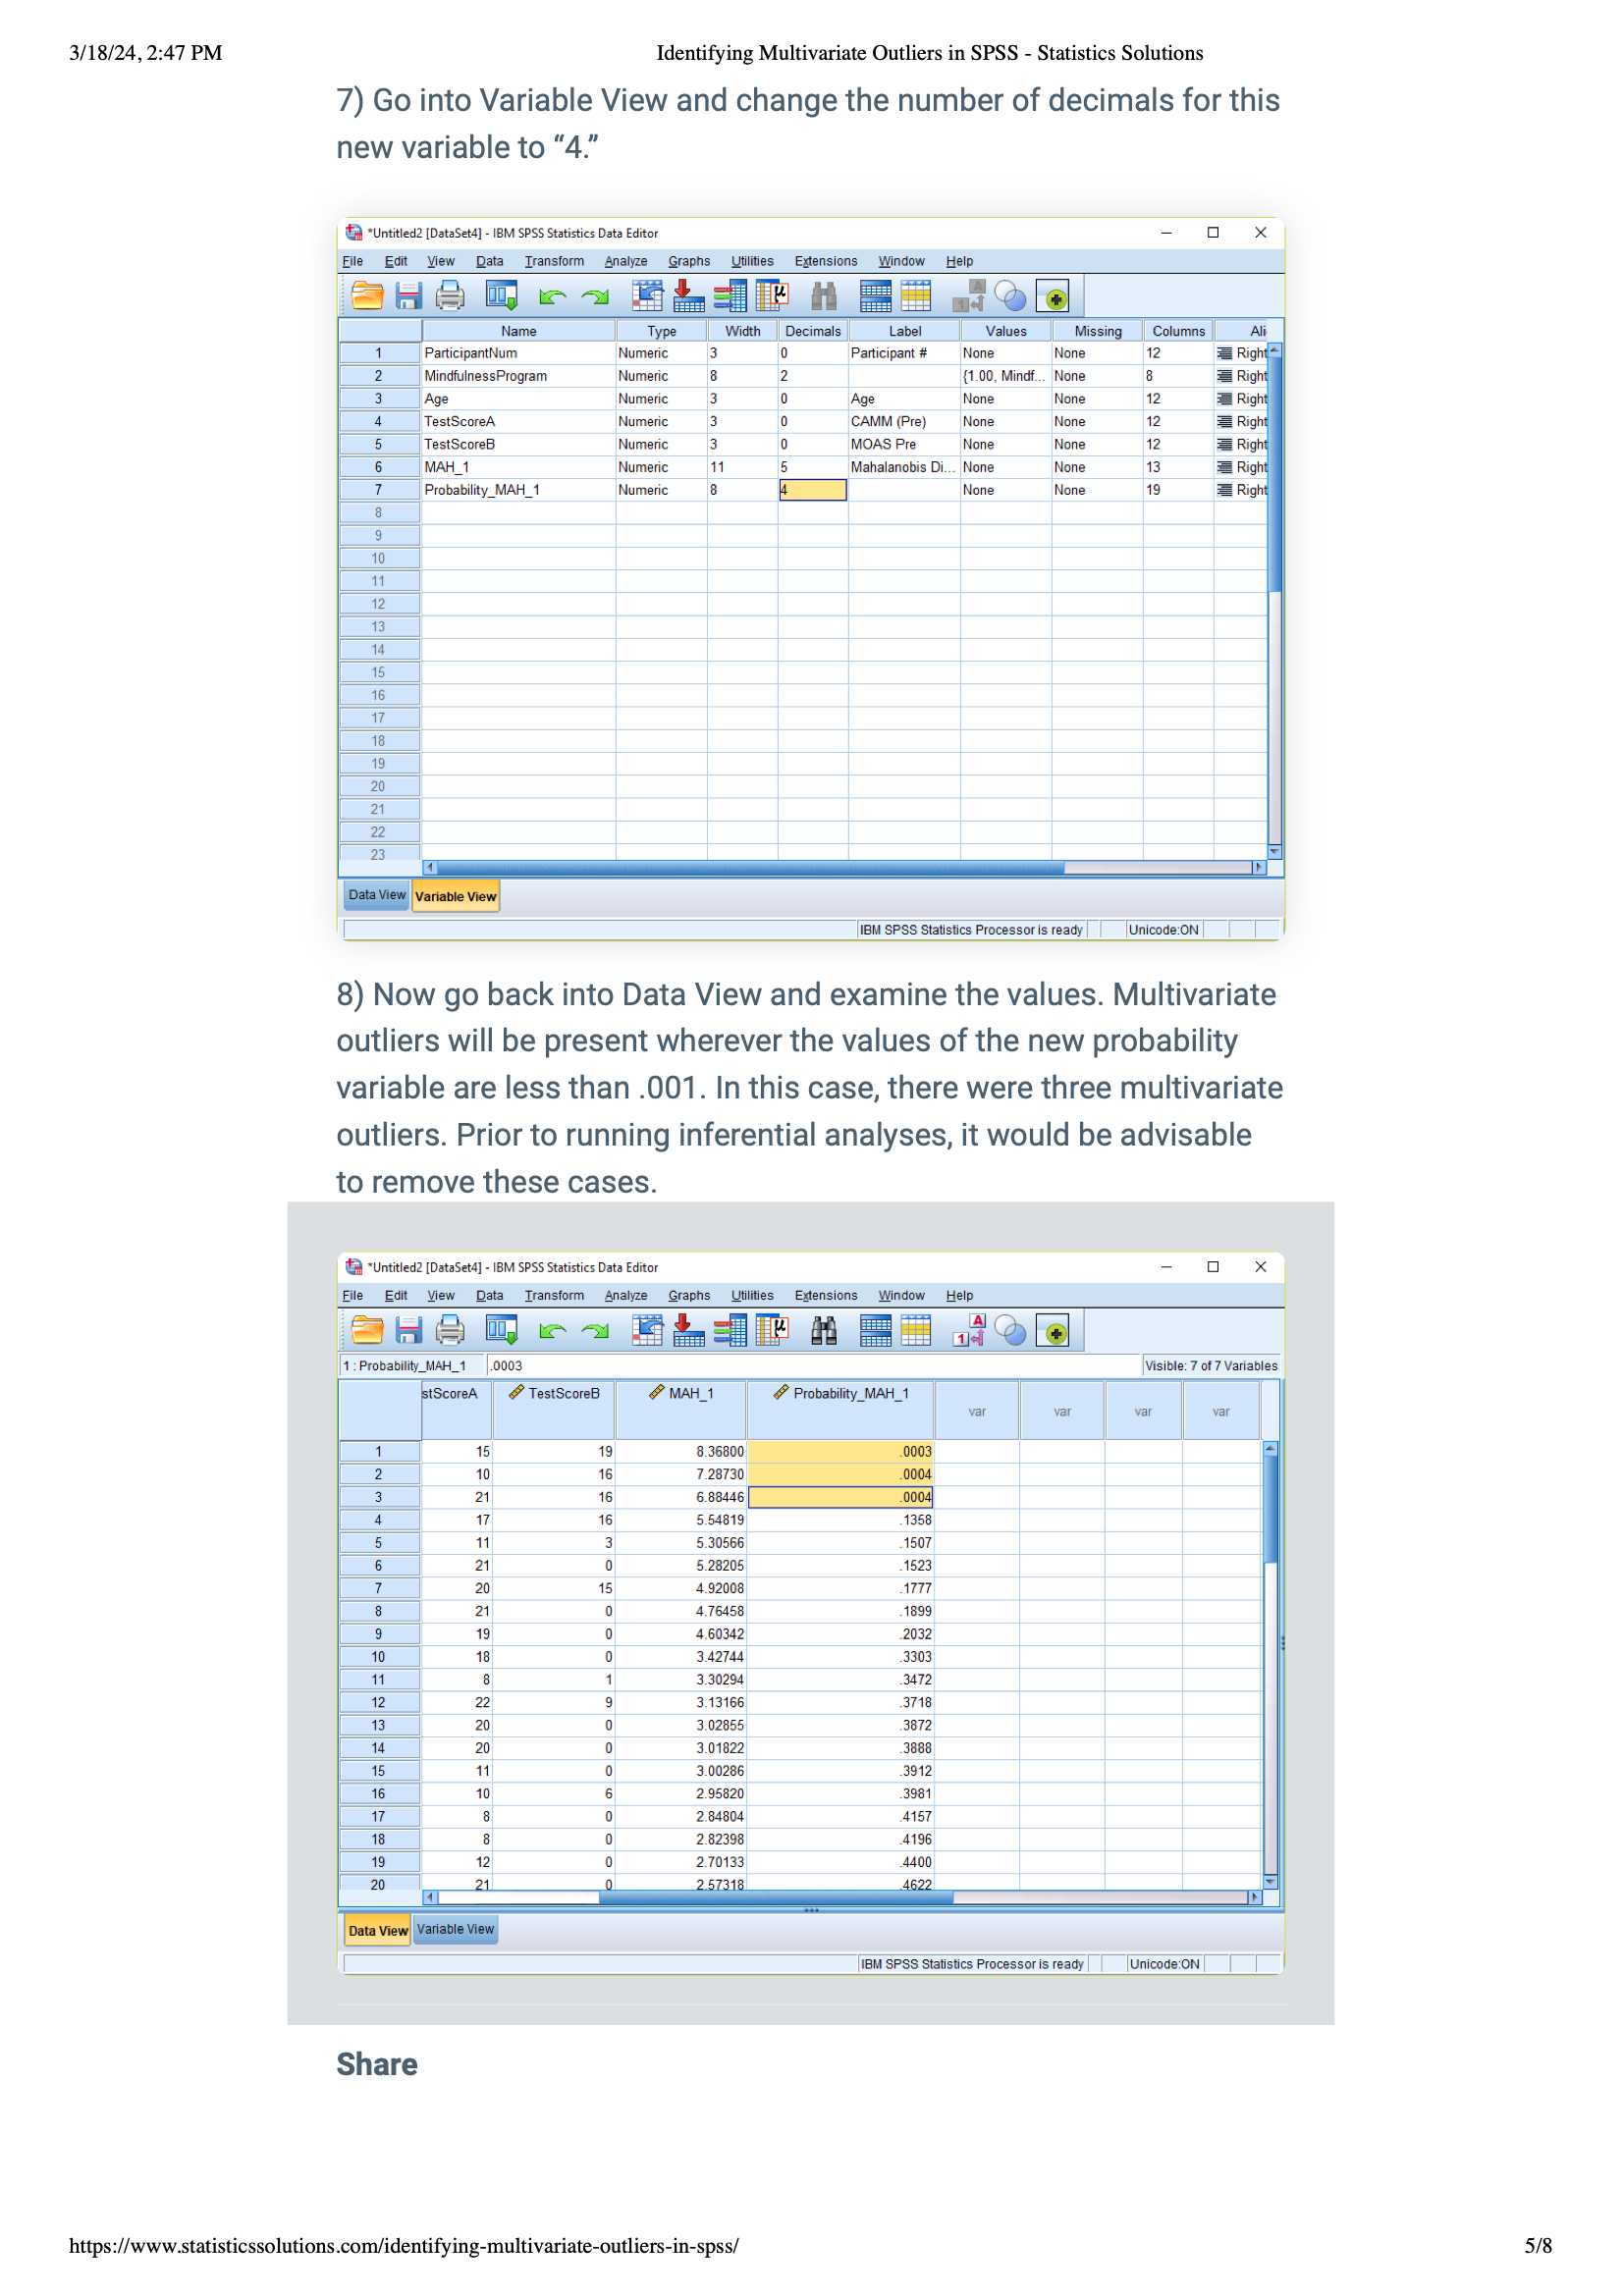
6)Setting Decimal Precision: Change the new variable’s decimal places to “4.” This makes your results clearer and more precise.
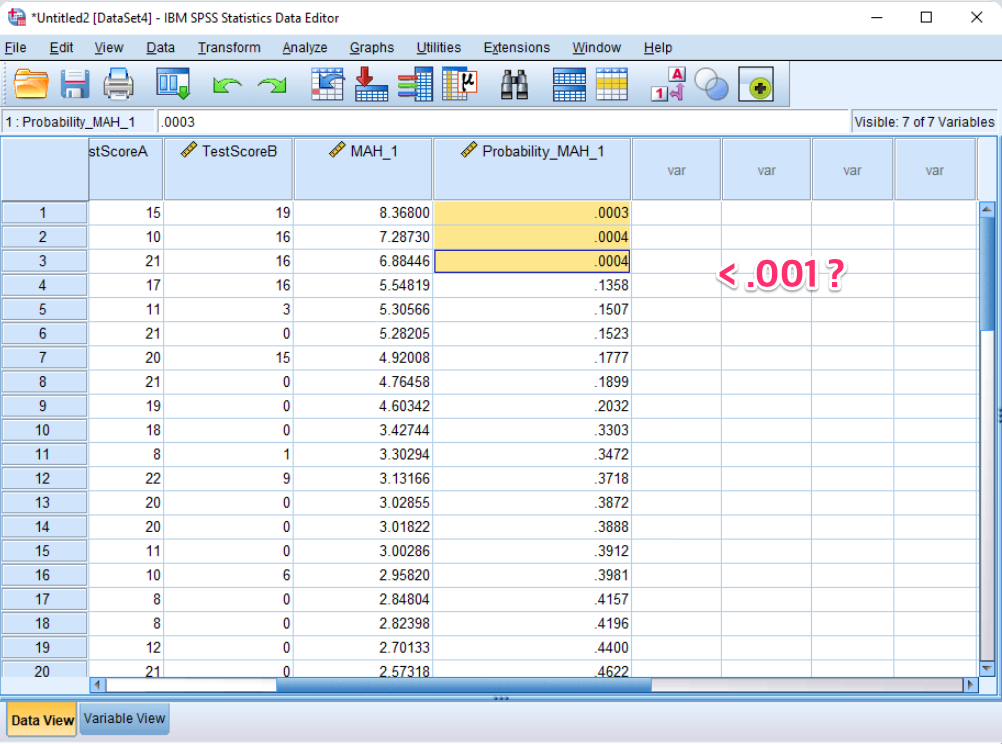
7) Finding Outliers: Look in the Data View for values of your new variable that are less than .001.
These are your outliers. It's a good idea to remove these from your data before doing any more analysis to keep your results accurate.
This systematic approach facilitates the rigorous examination and removal of multivariate outliers, ensuring the robustness and validity of statistical findings derived from complex data sets.
https://www.statisticssolutions.com/identifying-multivariate-outliers-in-spss/
Identifying Multivariate Outliers in SPSS
Multivariate outliers are typically examined when running statistical analyses with two or more independent or dependent variables.
www.statisticssolutions.com


댓글